This is a web-based and GIS-enabled tool for calculating linkages between water, energy, and food to ensure that they are utilized efficiently, sustainably, and equitably, towards the security of the strategic resources. My contribution is witnessed here.
The project is an open-source web-based and GIS-enabled integrative water-energy-food (WEF) nexus analytical model (iWEF). It is an analytical model with geospatial analytic capabilities that GIS enables. iWEF comprehensively assesses trade-offs and synergies to increase productivity and efficiency in resource use and management for sustainable development to support better WEF nexus performance assessment, monitoring, and evaluation. The tool is based on the MS Excel-based model for establishing quantitative relationships among WEF nexus sectors to indicate resource utilisation and performance over time.
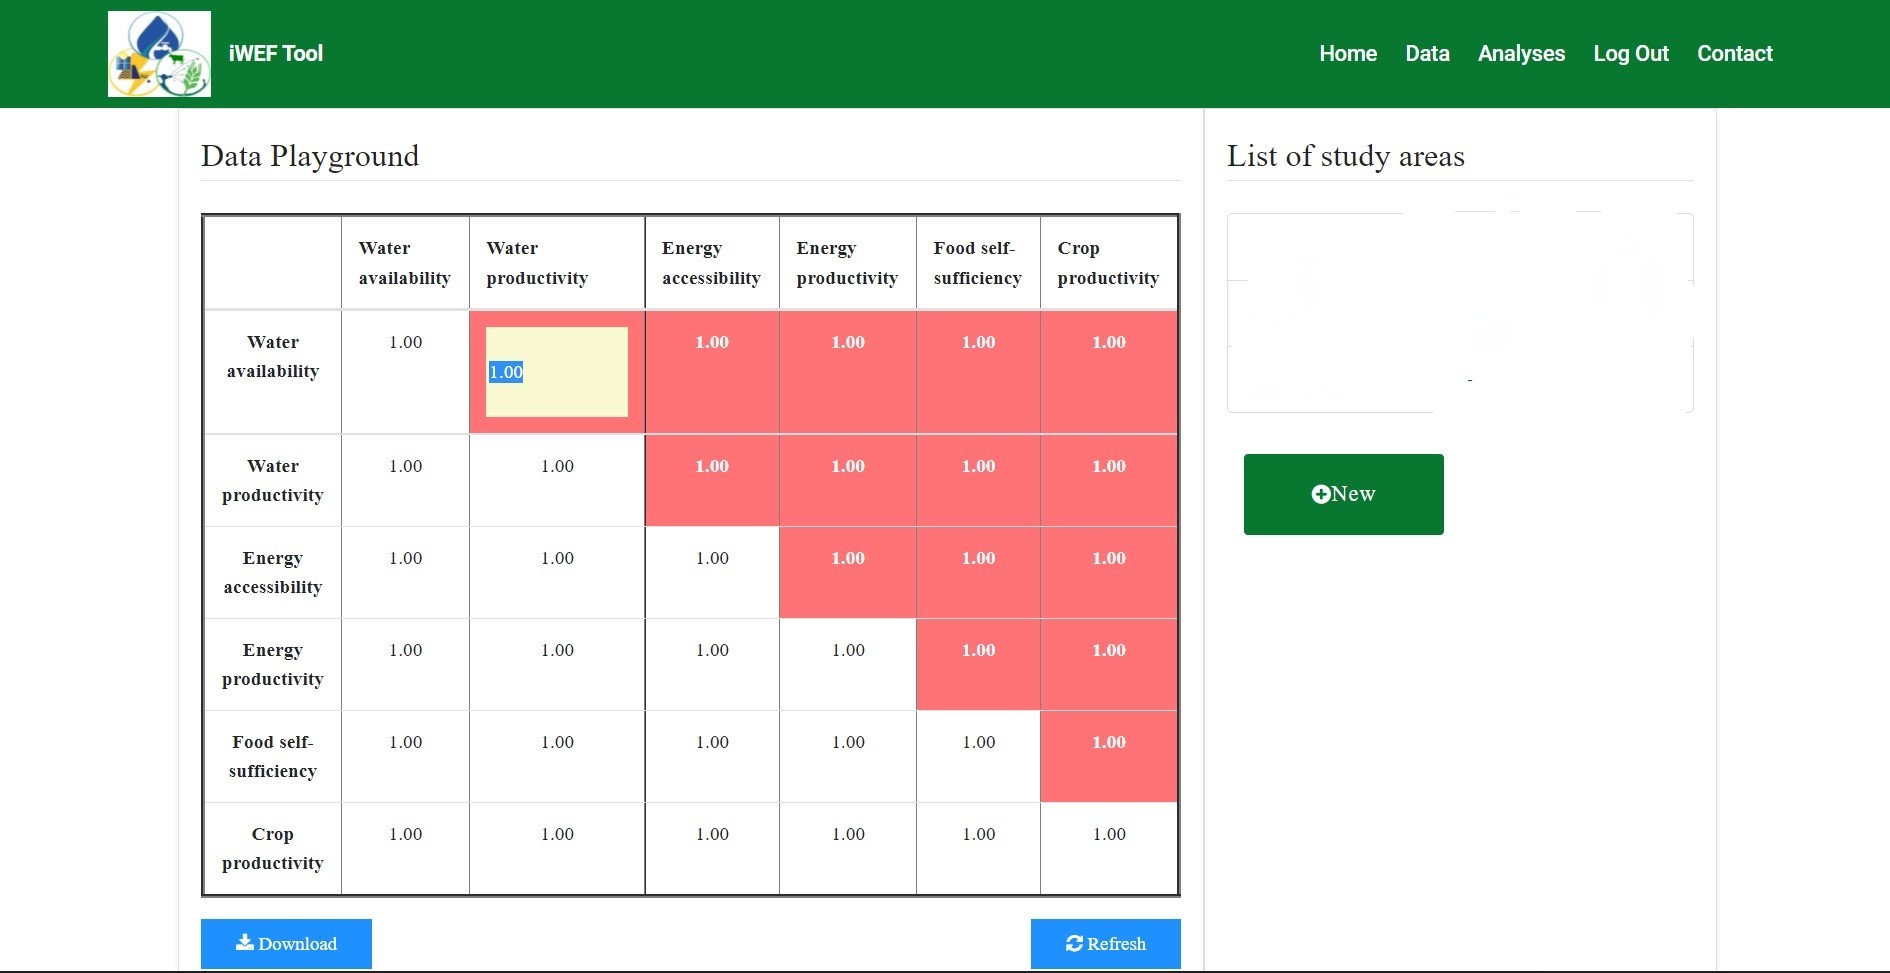
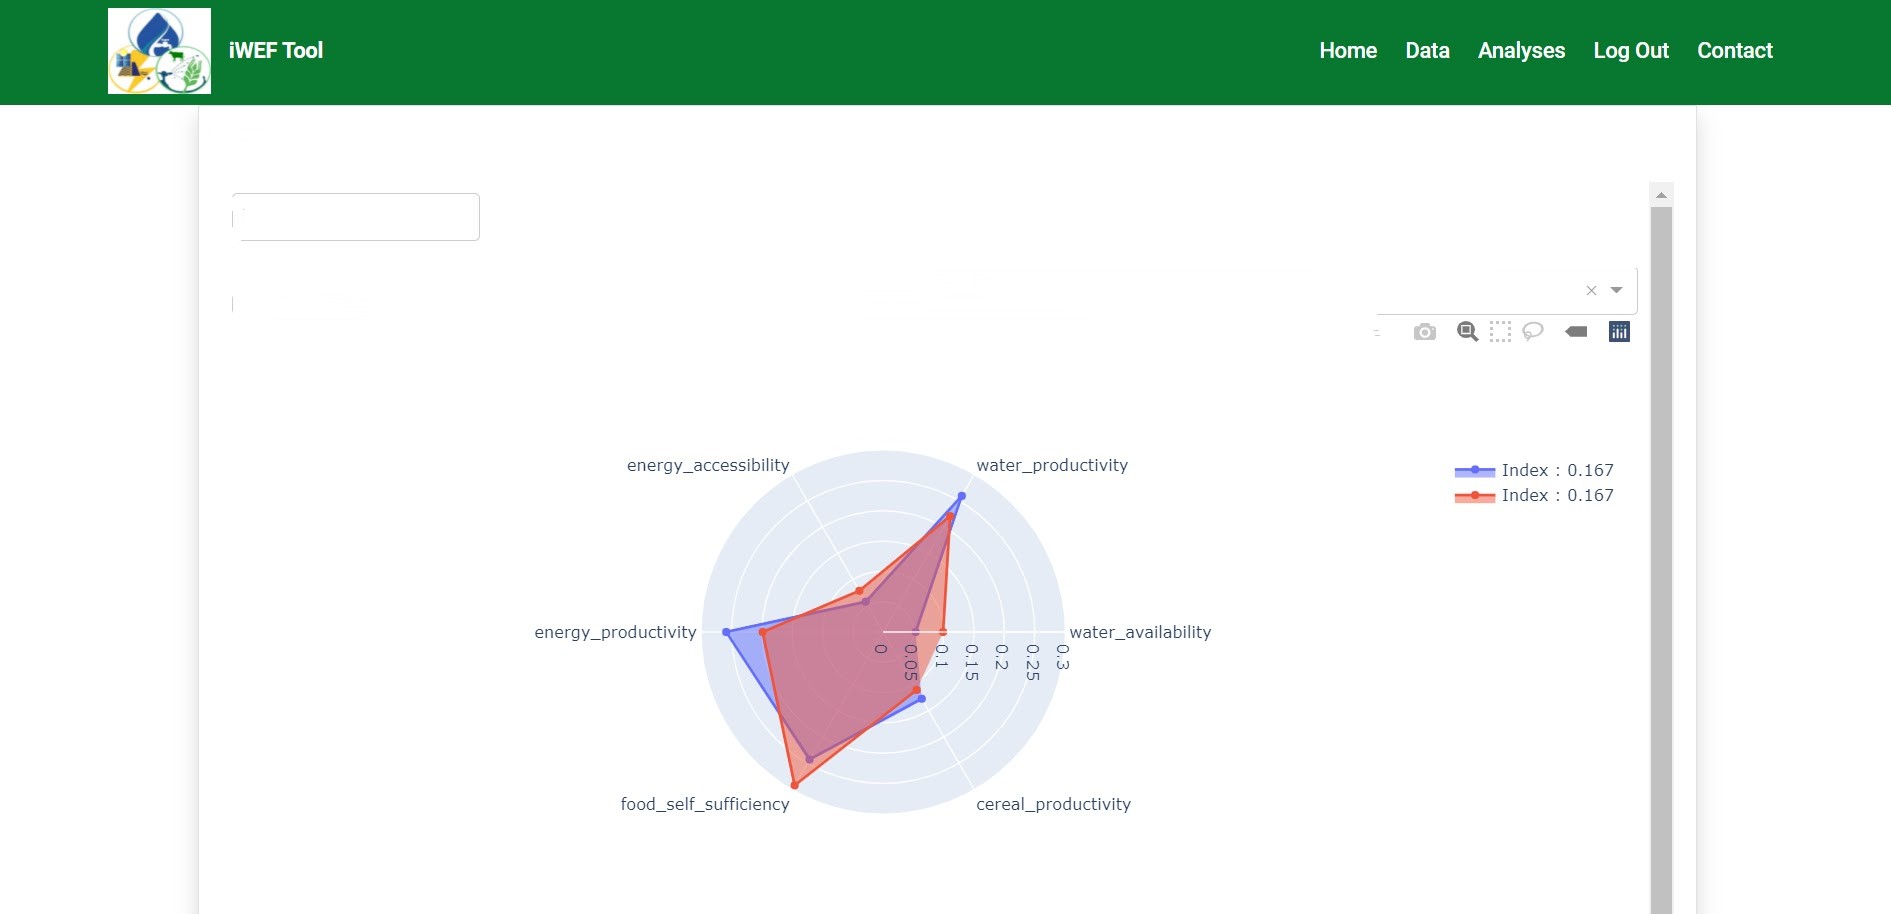
The six WEF sustainability indicators—water availability (m3/capita), water productivity ($/m3), energy accessibility (%), energy productivity (MJ/GDP), food self-sufficiency (%), and cereal productivity (kg/ha)—are the primary input data for iWEF modelling which are compared pairwise in a pairwise comparison matrix. The iWEF tool normalizes WEF indicator data to create composite indices that are then used to calculate the weighted average WEF nexus index. This allows the tool to integrate the six WEF indicators through the Analytic Hierarchy Process multi-criteria decision-making approach.
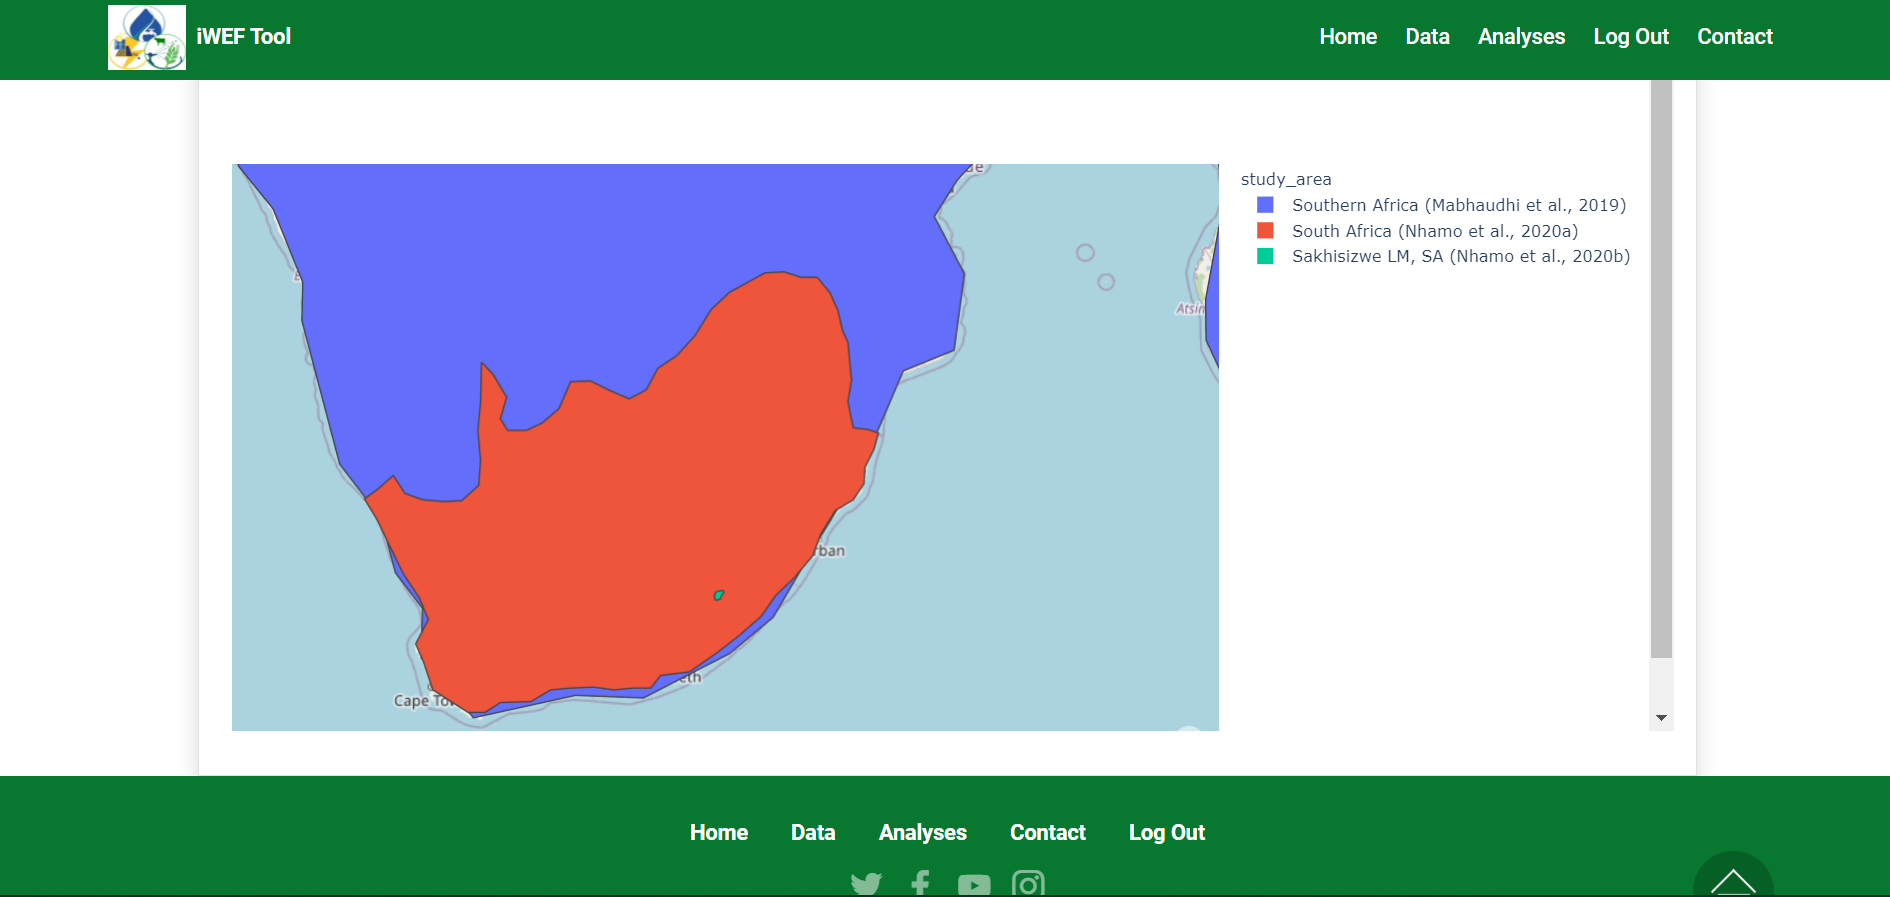
The integrated WEF nexus value, which can be interpreted based on its level or class of sustainability and ranges from zero to one, is determined by the iWEF model. A spider graph of normalized indices and maps—also known as a radar chart or sustainability polygon—is one of the primary outputs of iWEF. The form of the radar graphic offers a summary of the degree of interactions, interdependencies, and interconnectedness among WEF nexus sectors, whose management is viewed as either sustainable or unsustainable, by illuminating WEF nexus indicator performance and inter-relationships. The maps highlight the hotspots and champions by displaying the spatial distribution of the WEF nexus in the relevant regions.
Key Features:
- User registration and login
- Indicators data with auto-filling of reciprocal cells above or below the diagonal
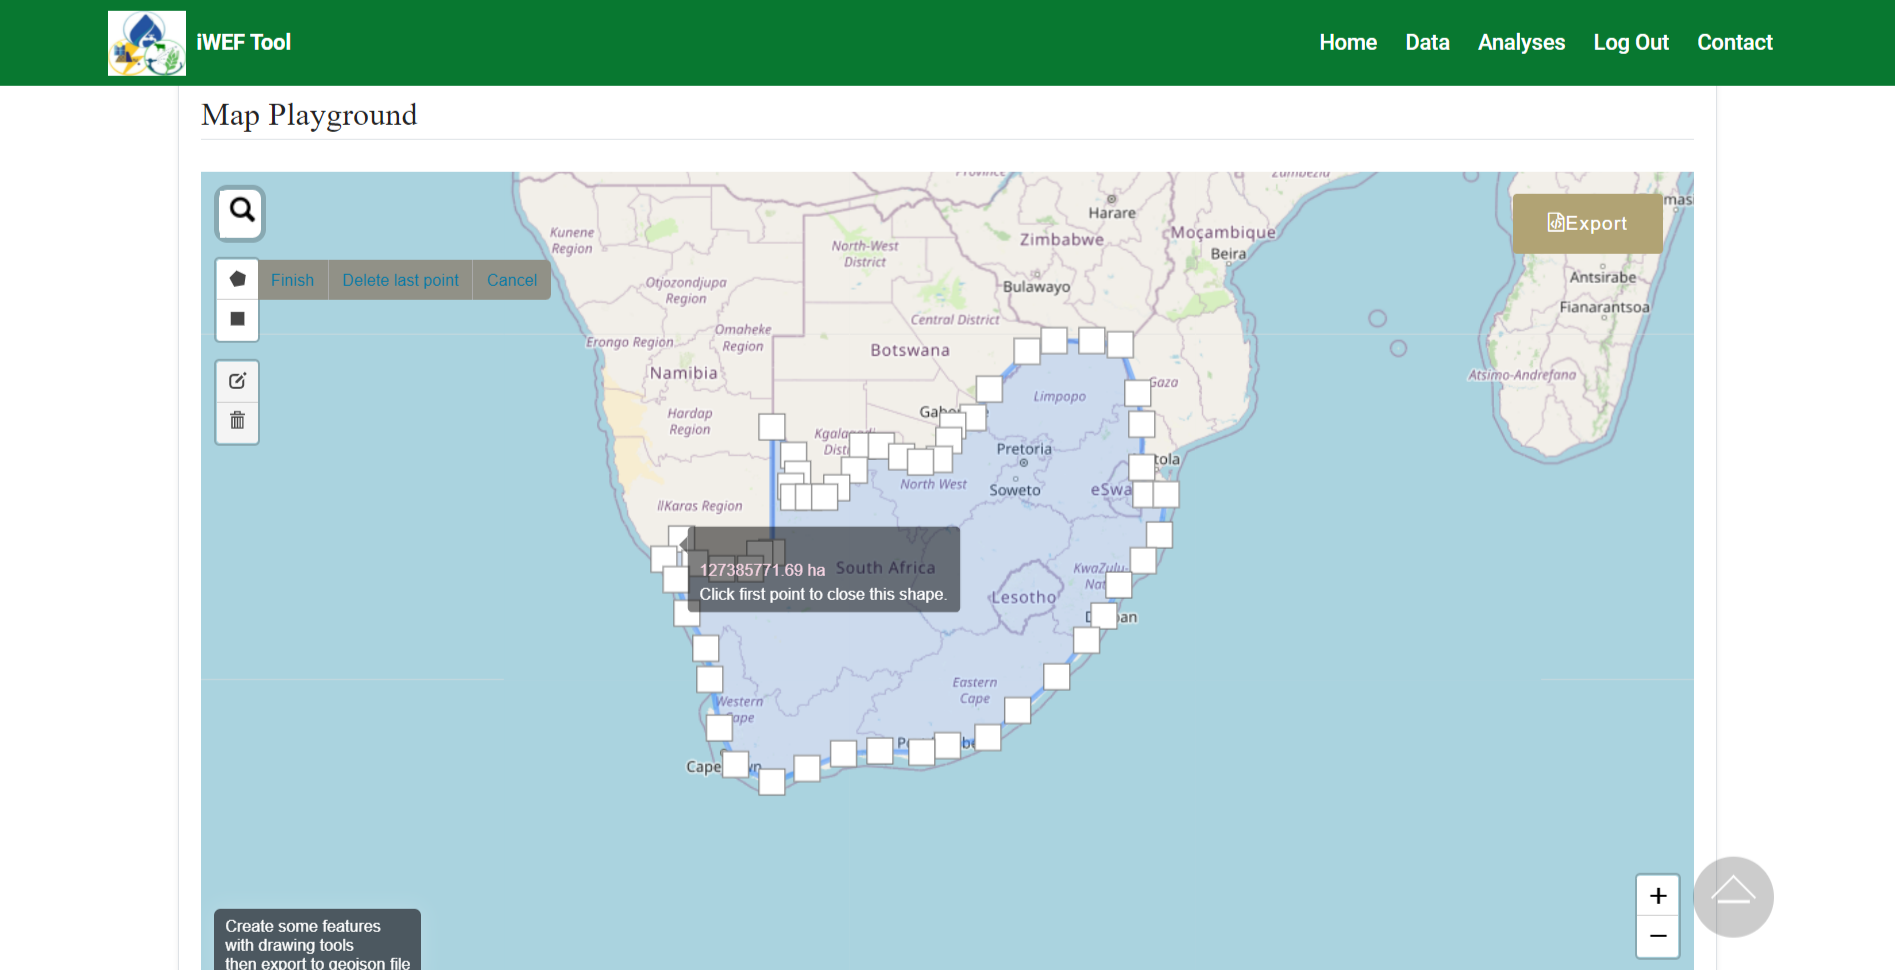
- Delineating the case study area
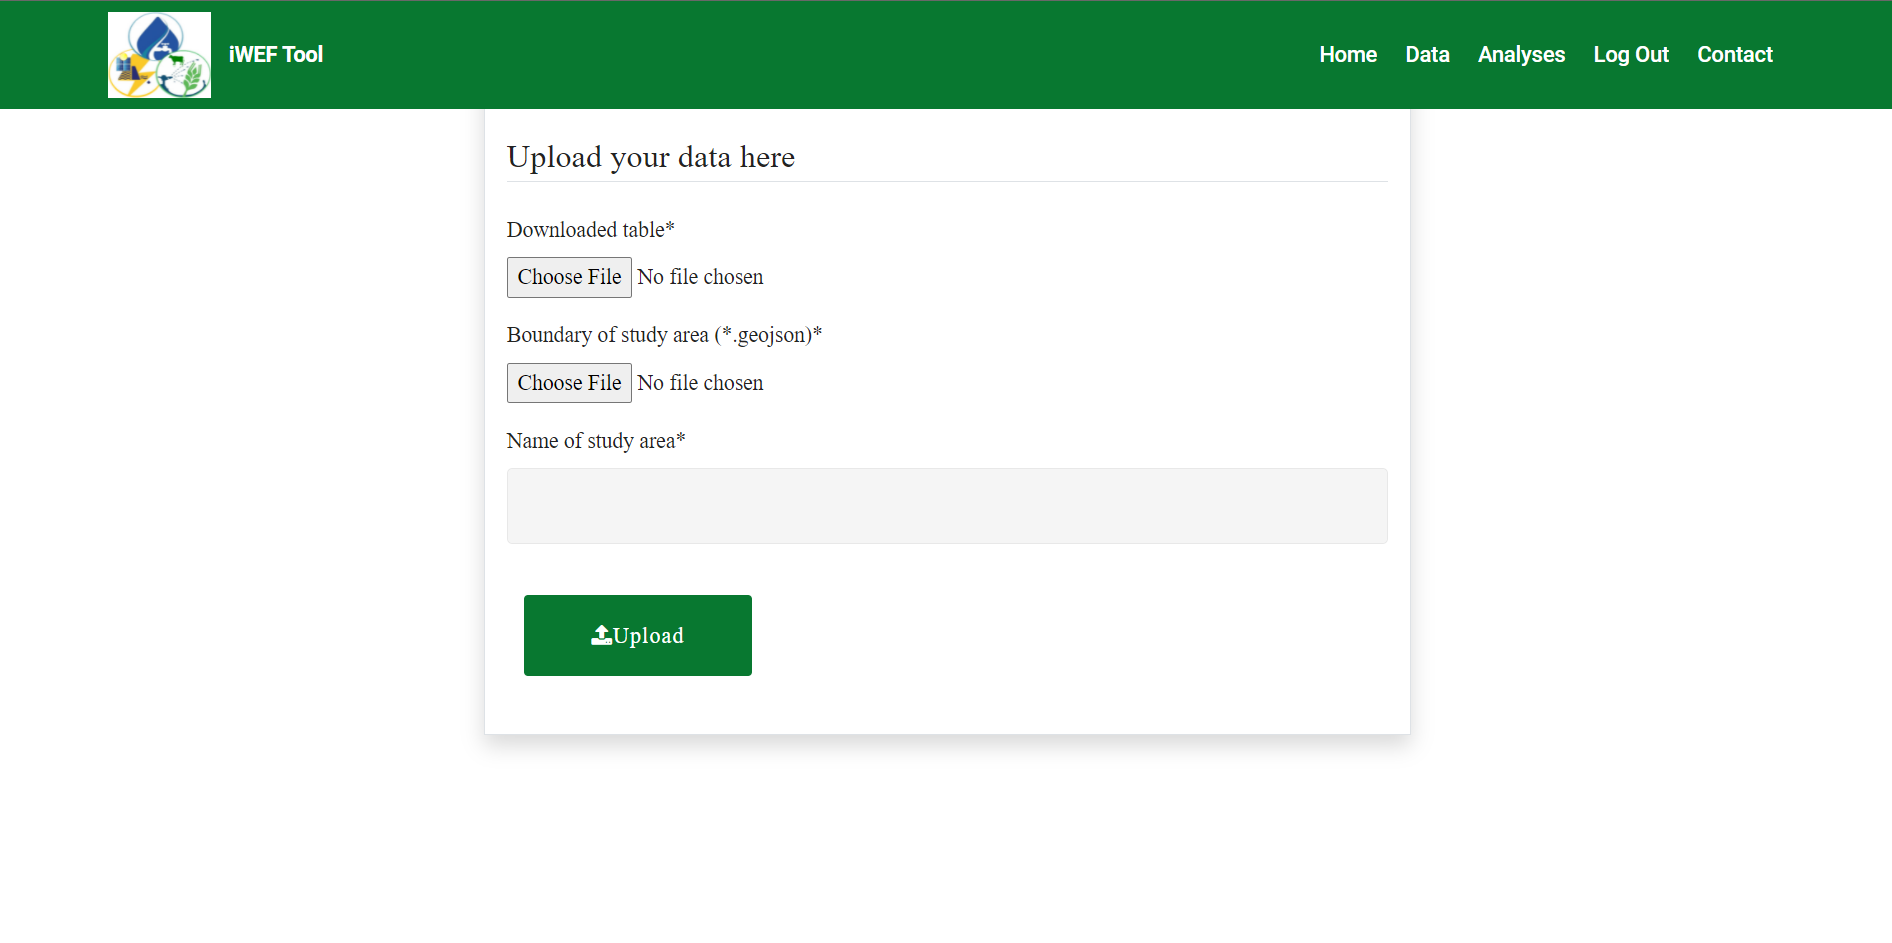
- Data export download, upload and edit
- Computing and displaying the WEF Nexus index